Main section
Image above: Grant of land issued during the reign of Mary I, Queen of England, and Philip II, King of Spain. Image credit: The National Library of Wales (ref: NLW MS 24145)
Click on the headings below to read our analysis of the 2019 Accessions to Repositories survey data:
Tabs Navigation
Tabs
Public records
Places of Deposit
In 2019, more than 100 local authority places of deposit (PoDs) contributed to the Accessions to Repositories Survey. Of these, 50 took in records eligible for New Burdens funding. This funding aims to aid local authorities in managing the costs associated with the accelerated transfer of records during the current transition from the 30-year rule to the 20-year rule. The funding began in 2015 and will continue until 2025.
Since 2015, there have been on average 49 PoDs each accessioning 30 linear metres (Lm) of eligible public records per year. This means that, between 2015 and 2019, PoDs have collected an average annual total of 1523.43 linear metres of public records and have been paid £446.08 per linear metre. In 2019, the total of eligible public records accessioned amounted to 2533.94 linear metres, which is the highest accession rate of public records since 2015, and resulted in a payout of £265.62 per linear metre. However, no eligible public records have yet been accessioned in digital format.
Places of Deposit data
Number of Places of Deposit eligible for New Burdens funding
2015: 47
2016: 60
2017: 47
2018: 43
2019: 50
Total eligible public records accessioned
2015: 1094.13 linear metres (23.27 Lm on average per PoD)
2016: 2088.24 linear metres (34.8 Lm on average per PoD)
2017: 809.24 linear metres (17.35 Lm on average per PoD)
2018: 1091.64 linear metres (25.38 Lm on average per PoD)
2019: 2484.81 linear metres (50.67 Lm on average per PoD)
New Burdens payment per linear metre
2015: £603.21
2016: £316.05
2017: £815.58
2018: £604.59
2019: £265.62
The most public records accessioned by a Place of Deposit
2015: Liverpool Record Office – 316.5 Lm (New Burdens payment of £190,865.29)
2016: Greater Manchester County Record Office – 229 Lm (New Burdens payment of £70,963.08)
2017: Staffordshire Record Office – 187.72 Lm (New Burdens payment of £153,099.54)
2018: Nottinghamshire Archives – 360.03 Lm (New Burdens payment of £155,431.04)
2019: London Metropolitan Archives – 556.73 Lm (New Burdens payment of £147,878.62)
Return to Part 1: Introduction
Continue to Part 3: New in archives
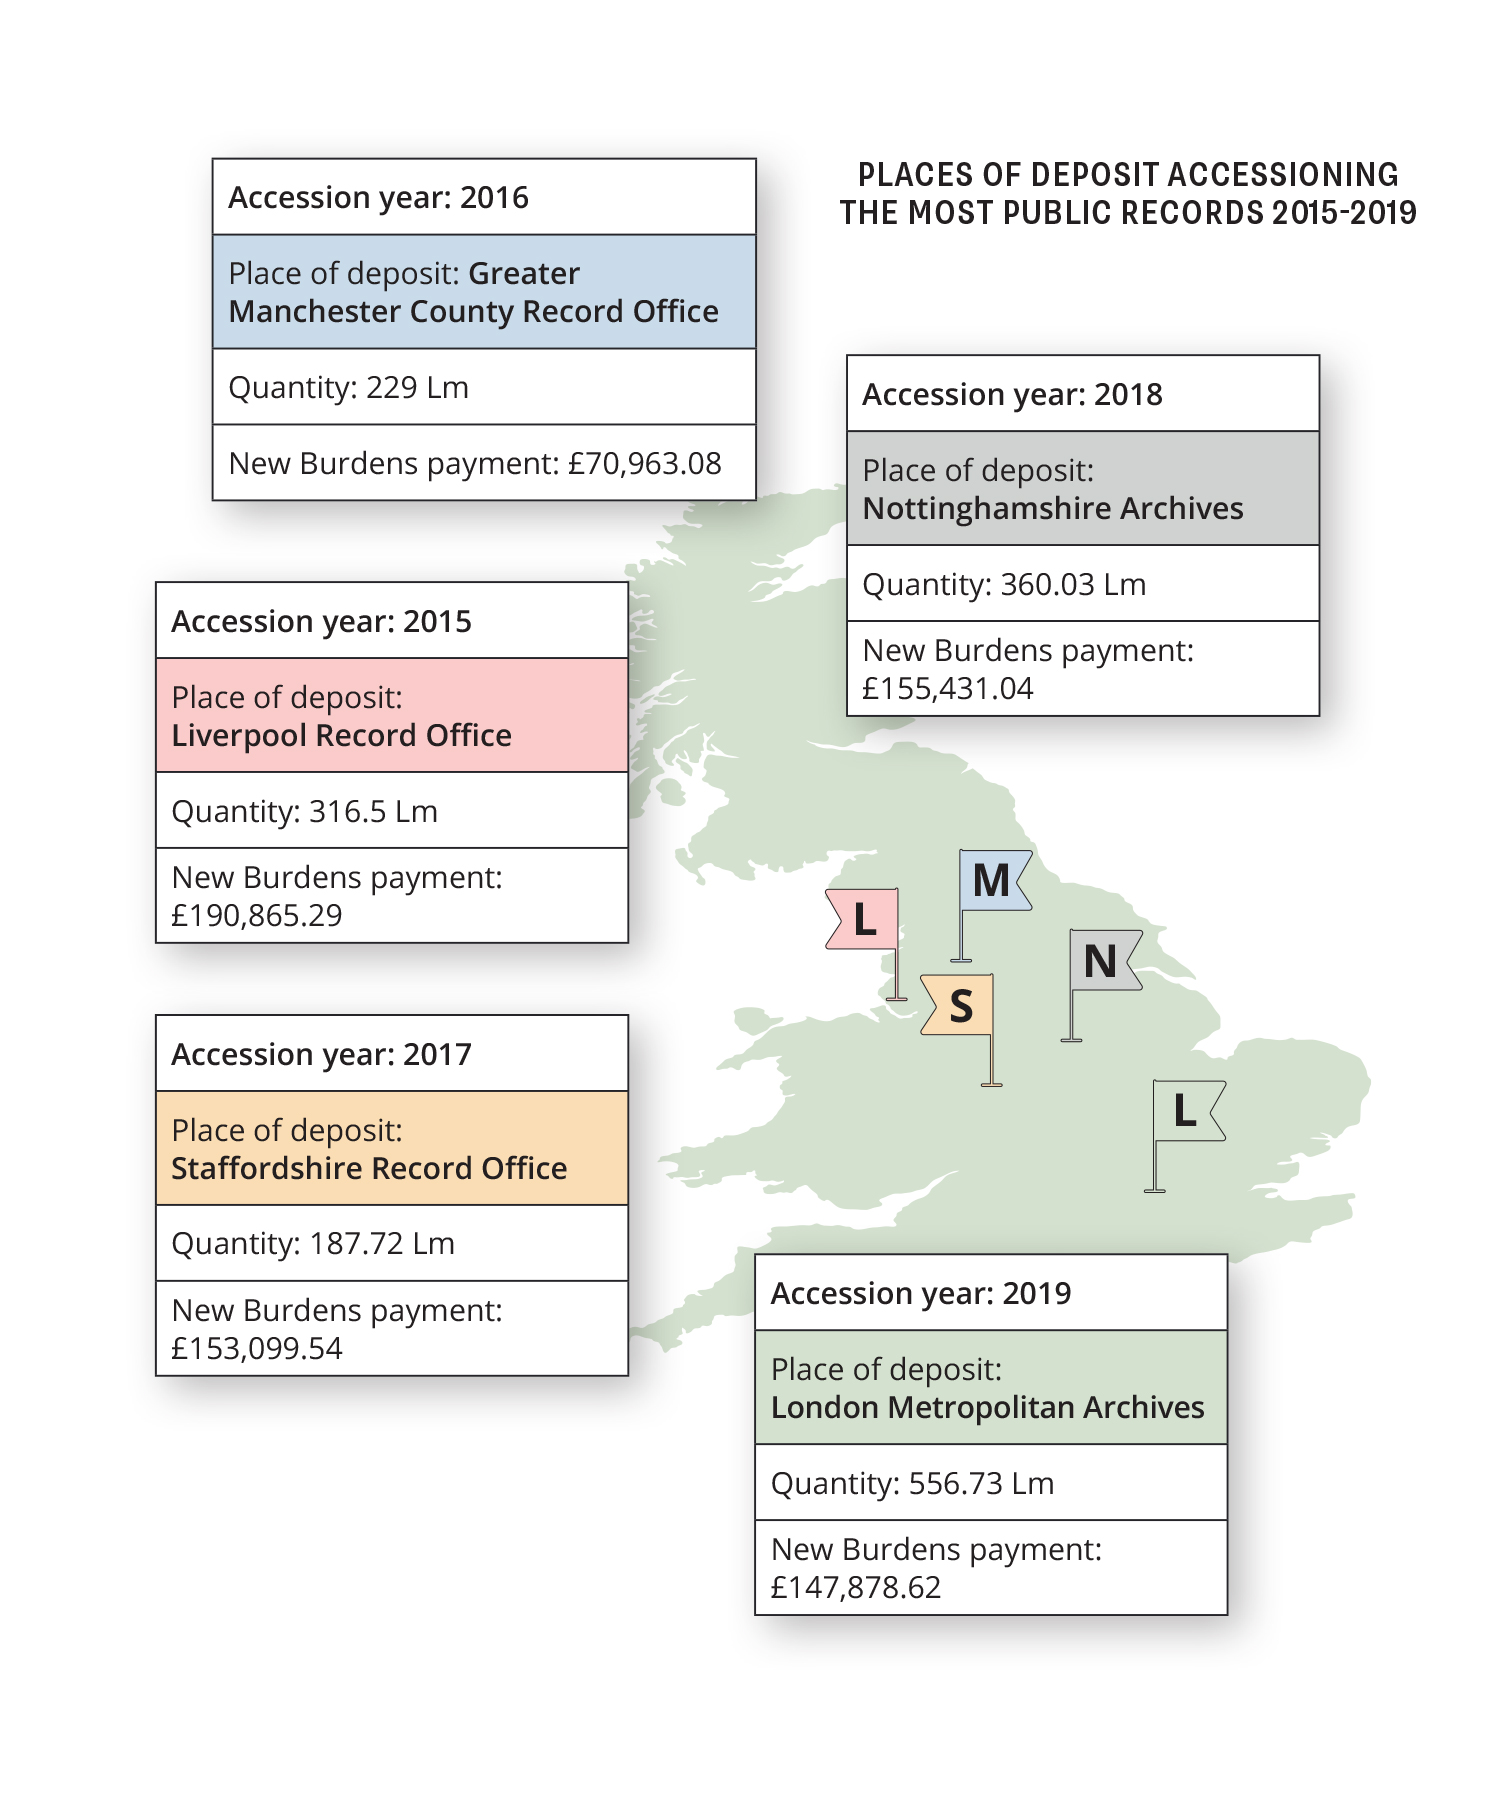
Map showing the Place of Deposit that accessioned the most public records between 2015 and 2019. (Design by Garlic Agency)
Digital accessions
In 2019, archives collected a total of 13,436.9 gigabytes (GB) – or over 13 terabytes (TB) – across 352 digital collections. This means that digital collections made up 2.46% of the 14,289 collections reported in the 2019 accessions survey. Although the percentage of digital collections accessioned was higher in 2018, at 3.6%, the total volume collected in 2019 (13.4 TB) was close to double the 2018 total.
The largest digital collection reported was 4 TB. Relating to the Aids since the 80’s project, these records consisted of digital oral history interviews from 2015 to 2017 that were accessioned by London Metropolitan Archives. Both Essex Sound and Video Archive and University of Glasgow Archives accessioned approximately 2 TB of digital copies of oral history interviews or digitised microfilm business records. Mirroring a similar pattern to the previous two years, more than half of the total volume of digital records accessioned in 2019 were collected by 3 institutions.
Accessions of digital collections – or at least the reporting of such collections as digital – has increased significantly since 2016, both in terms of size and as a percentage of records collected as a whole. In general, university and national archives have tended to acquire a higher percentage of digital records than specialist and local repositories. However, compared to the volume of records accessioned overall, the number of digital collections remains very low.
Digital collections accessioned
2016: 0.11 terabytes (0.22% of all collections accessioned)
2017: 18.2 terabytes (1.8% of all collections accessioned)
2018: 8.3 terabytes (3.6% of all collections accessioned)
2019: 13.4 terabytes (2.46% of all collections accessioned)
Return to Part 1: Introduction
Continue to Part 3: New in archives
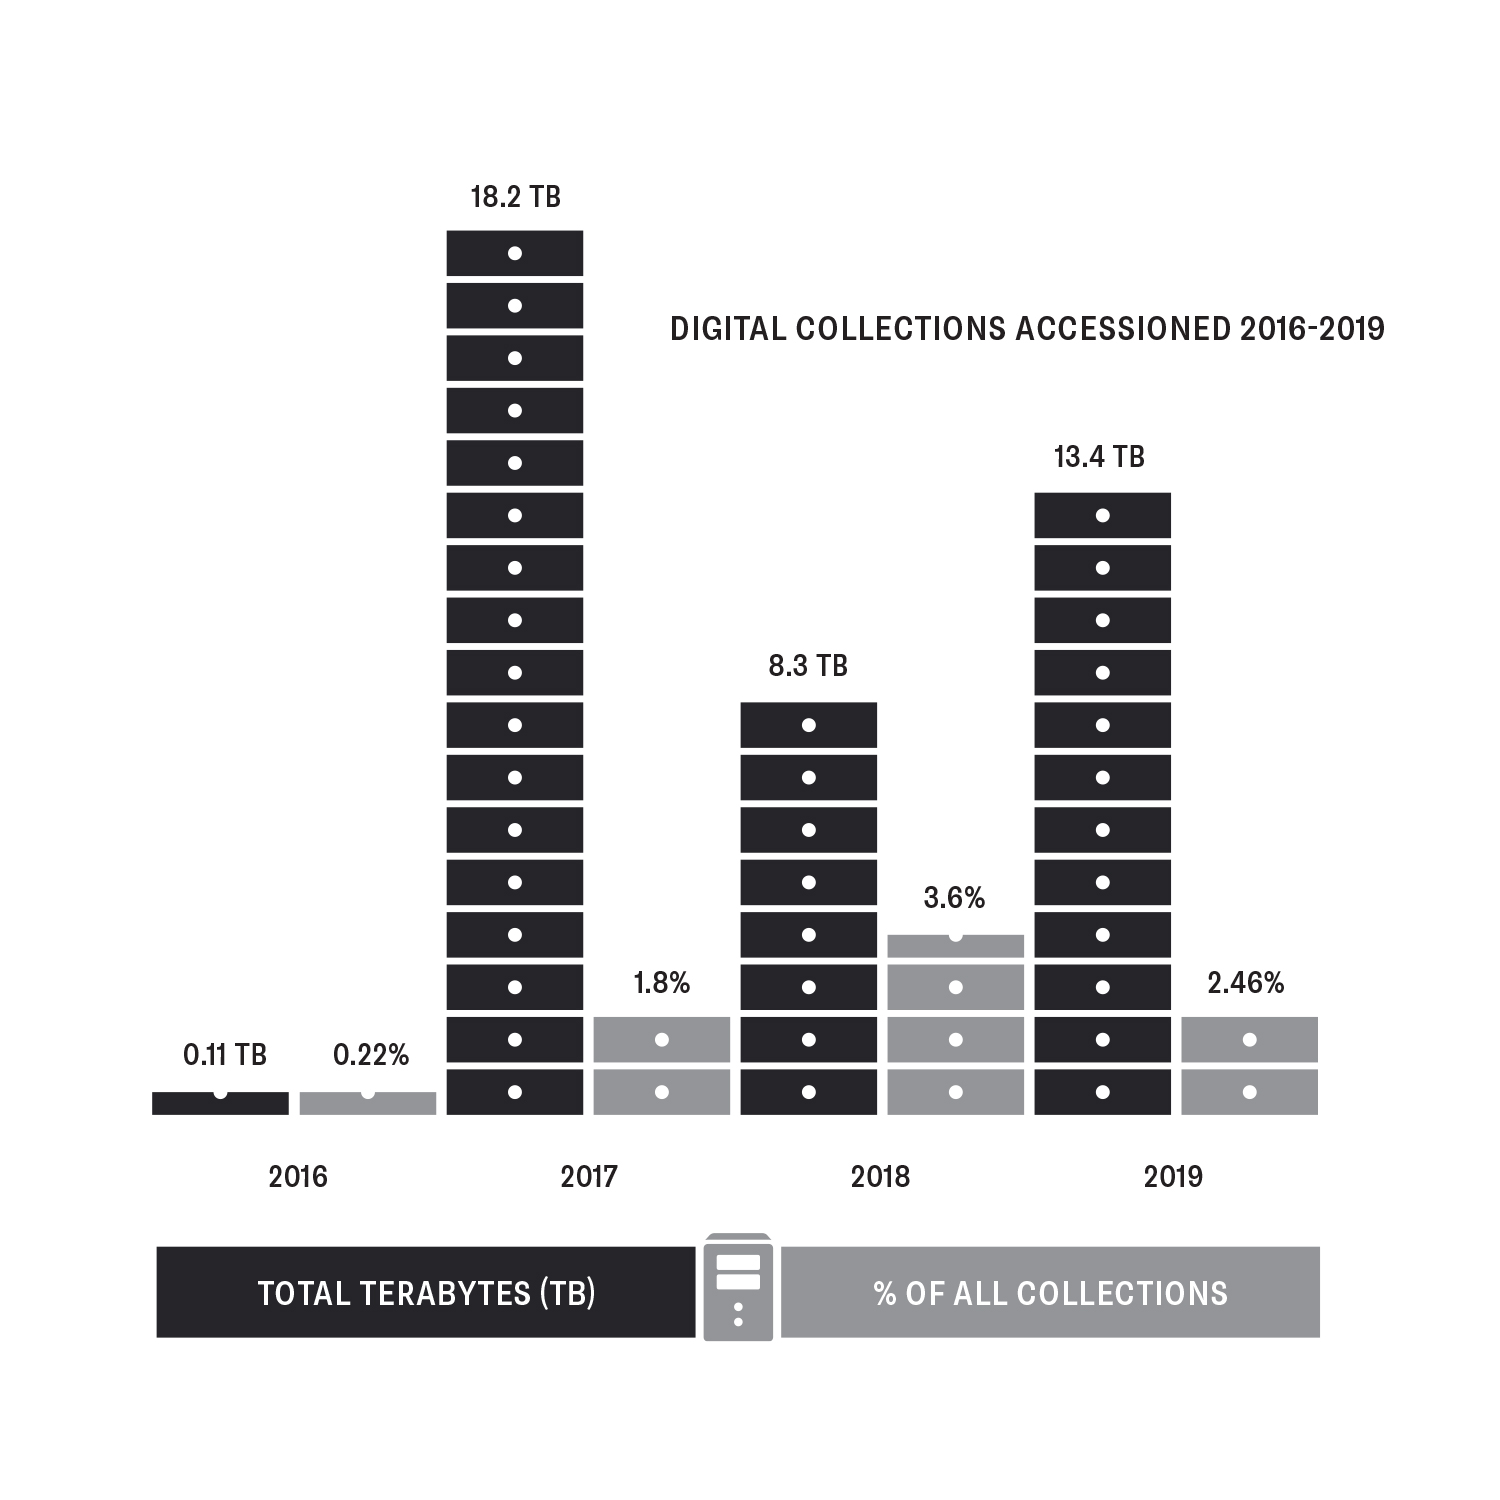
Digital collections accessioned between 2016 and 2019. (Design by Garlic Agency)
Keywords
Overall, the keywords from the 2019 accessions appear to show little variation from previous years, suggesting considerable stability in collecting and descriptive practices. However, much of this could be attributed to the more than 100 local authority archives that make up a significant portion of those contributing to the dataset. These archives account for more than 10,000 collections in total each year, but these collections are often of very similar types, with a focus on church (or parish), school and council records. This may account, at least in part, for the overall picture of rather stable and unchanging collecting patterns.
Frequent words in accession descriptions
Church: 1345 (1085 in 2018)
School: 1053 (1050 in 2018)
St: 872 (900 in 2018)
Parish: 865 (817 in 2018)
Council: 791 (809 in 2018)
History: 740 (609 in 2018)
Family: 645 (576 in 2018)
Service: 609 (562 in 2018)
Marriage: 554 (449 in 2018)
John: 468 (438 in 2018)
Meeting: 466 (475 in 2018)
War: 433 (358 in 2018)
Street: 402 (439 in 2018)
Research 378 (345 in 2018)
Plan: 373 (382 in 2018)
Account: 351 (245 in 2018)
Hospital: 298 (455 in 2018)
Meetings: 297 (356 in 2018)
London: 190 (357 in 2018)
Volume: 167 (405 in 2018)
Return to Part 1: Introduction
Continue to Part 3: New in archives
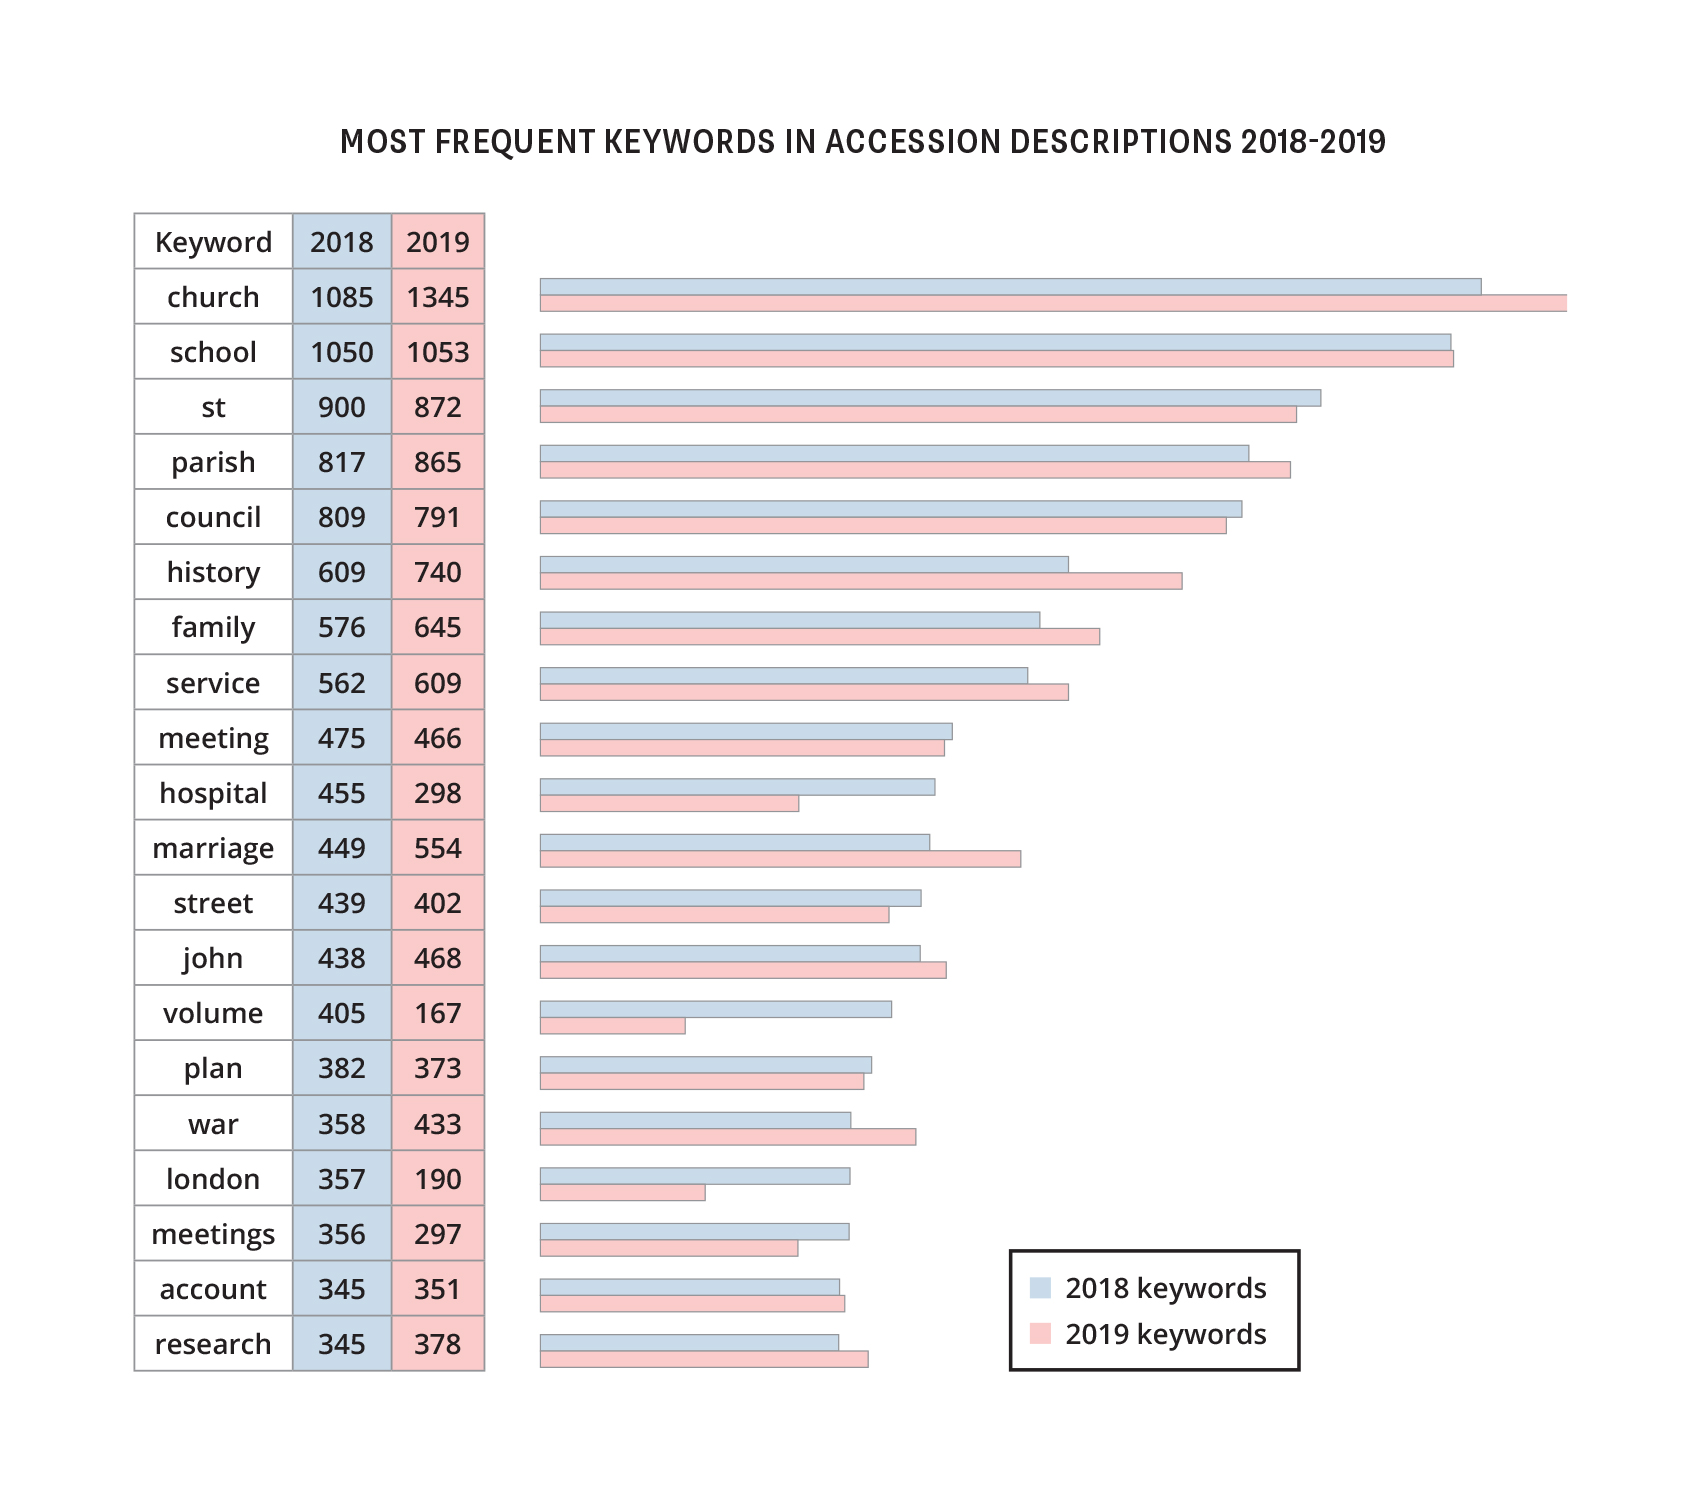
Most frequent keywords in accession descriptions for 2018 and 2019. (Design by Garlic Agency)
Dataset diversity
A similar picture of collecting stability emerges in the keywords that national, specialist and university archives used to describe their accessioned records. National institutions continue to focus on war, the top terms for specialist archives have remained hospital and nursing, and the accessions of university repositories centre on their own organisation and research. However, national and university archives have shown some variety in keywords used to describe their accessions over the last 4 years, such as how the word ‘digital’ has appeared among the top terms for these institutions in 2019.
While it’s a fairly rudimentary form of analysis, it is also possible to use keywords to estimate further the level of diversity within the accessions data set. Looking at the top values for each year, we can also look for equivalent words from various cultures or ways of life. Taking, for example, ‘parish’ and ‘church’, which have a frequency of well over 500 each year between 2016 and 2019, we can then search the dataset for terms related to other religions. For instance, ‘Jewish’ or ‘synagogue’appear between 8 and 17 times in the same four years. ‘Islam’, ‘Muslim’ or ‘mosque’ have a frequency of less than 5 per year, with ‘Hindu’, ‘temple’ or ‘mandir’ returning similarly low numbers.
Counting instances of male and female pronouns within the record creator field of the accessions data goes some way towards revealing the gender divide in accessioned records. The data again shows a relatively stable, albeit unequal picture, with male pronouns about twice as frequent as female equivalents.
Pronouns in accessions data
2016: 68.28% male pronouns, 31.72% female pronouns
2017: 69.56% male pronouns, 30.44% female pronouns
2018: 73.37% male pronouns, 26.63% female pronouns
2019: 67.23% male pronouns, 32.77% female pronouns
Return to Part 1: Introduction
Continue to Part 3: New in archives
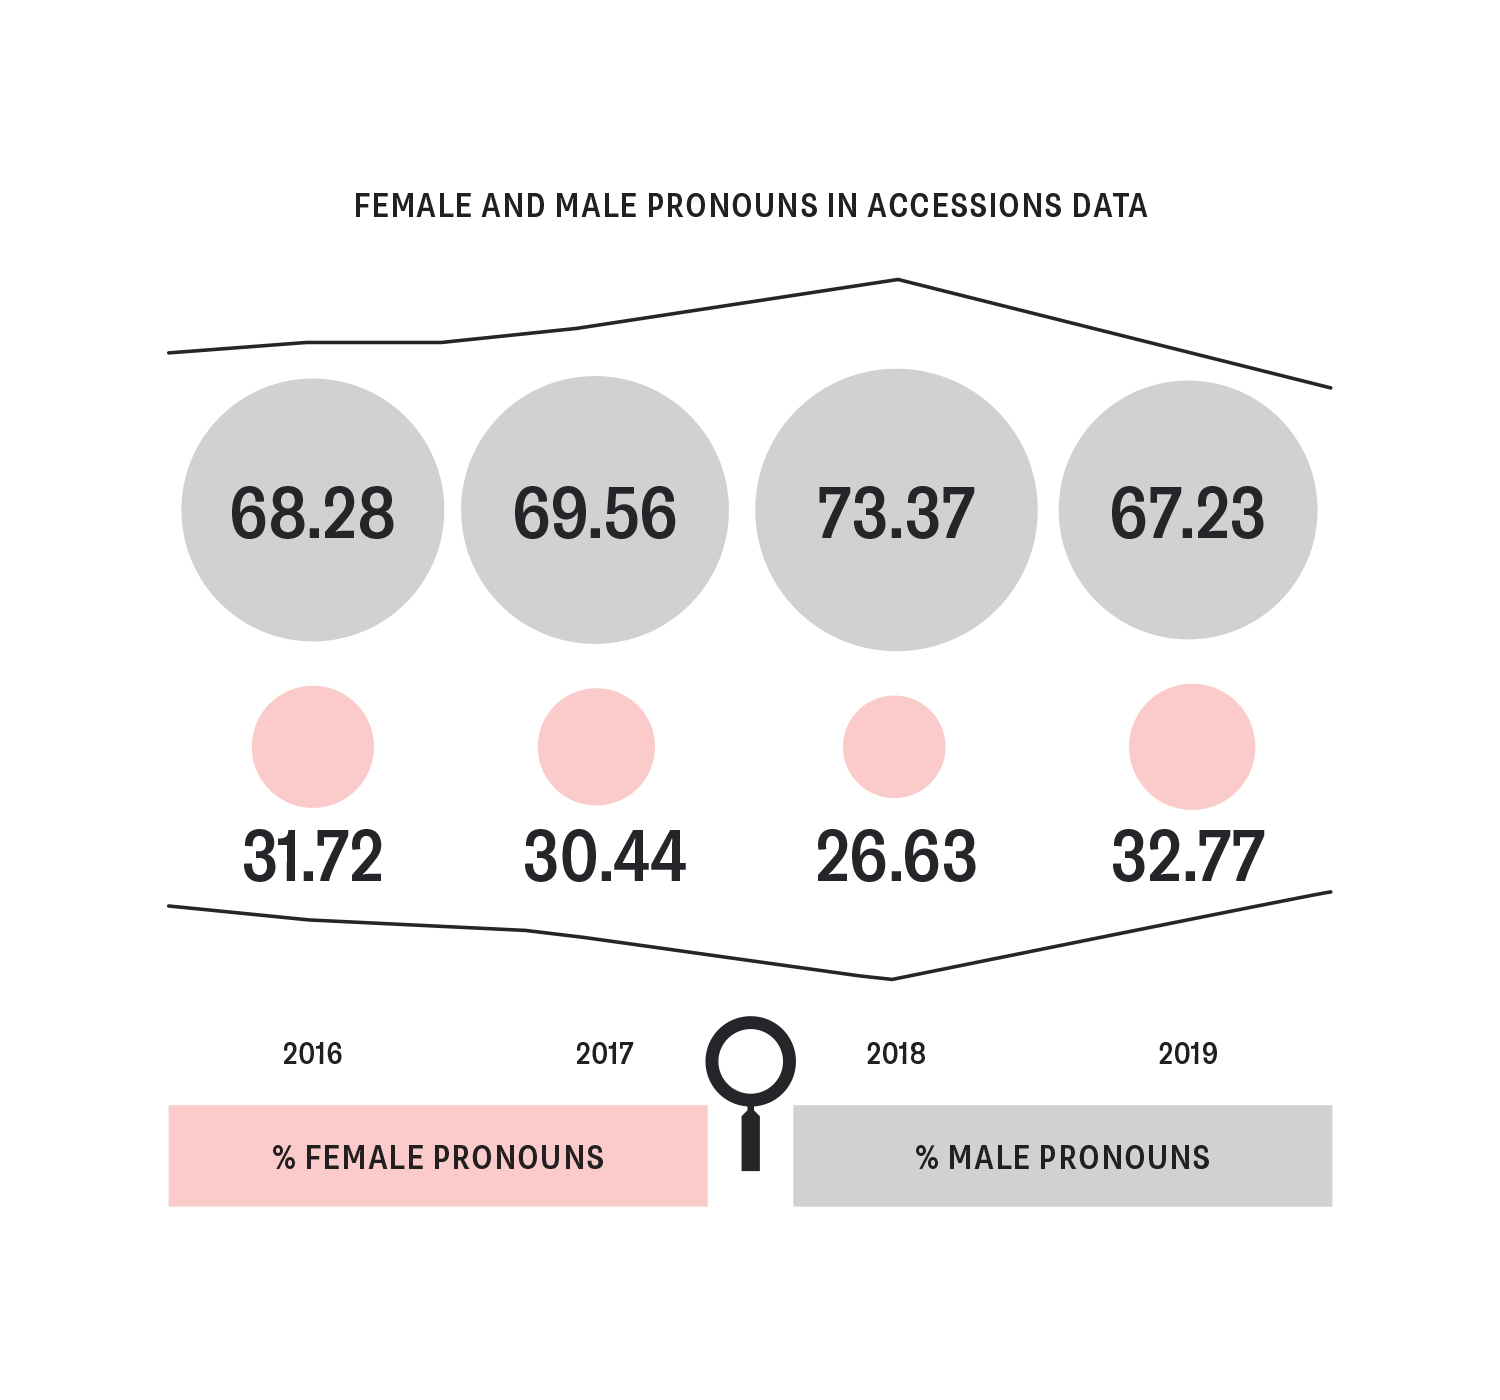
Female and male pronouns in accessions data between 2016 and 2019. (Design by Garlic Agency)