Main section
Tabs Navigation
Tabs
Introduction
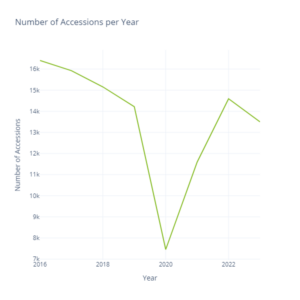
The annual Accessions to Repositories Survey seeks to provide insights into archival collecting practices across the UK. 245 archive services participated in the 2023 survey, reporting more than 13,500 new collections that they acquired over the previous 12 months.
- 29 repositories accessioned 56 collections of manorial documents
- More than 50 services purchased a total of 150 collections that were up for sale
- Places of Deposit acquired 309 collections of public records, 134 of which were eligible for New Burdens funding. 2024 is the last year of New Burdens funding and Places of Deposit must declare their eligible public record accessions in the 2024 Accessions Survey to be eligible for this funding.
 The types of material collected vary considerably both in format and theme and range from family and estate papers to hospital records, archives of businesses, community and oral history projects and medieval manuscripts.
Examples of new collections include:
- The contemporary Fuel Theatre Company’s records were taken in by Queen Mary University of London, including correspondence, annotated scripts and production and company accounts.
- Tower Hamlet Local History Library collected the records of Stepney Community Trust’s digital oral history project called ‘Home Machinists (Seamstresses): Untold stories of first-generation Bangladeshi Women in East End (1970-90)’.
- The Wellcome Collection accessioned a medical compendium, dating from around 1687 and written by an aspiring surgeon, with insights into surgical education and the tools of the trade at the time.
- A chart showing the Spanish Armada off the coast of Lisbon on 29 May 1588 was acquired by the National Museum of the Royal Navy.
Thank you to all the archives that contributed to the 2023 Accessions to Repositories Survey and helped us continue to obtain a better view of collecting across the sector.
Change over time
The Accessions to Repositories Survey has been carried out in some shape or form for many decades but we have been collecting the data in its current, analysable, format since 2016. Looking at data from the past eight years allows us to show change over time.
The graph below demonstrates the significant impact the pandemic had on collecting, though the sector has now largely recovered. However, the overall trend shows a slight decline in the number of accessions reported year on year. It’s possible that resource constraints make both collecting and reporting these collections more challenging.
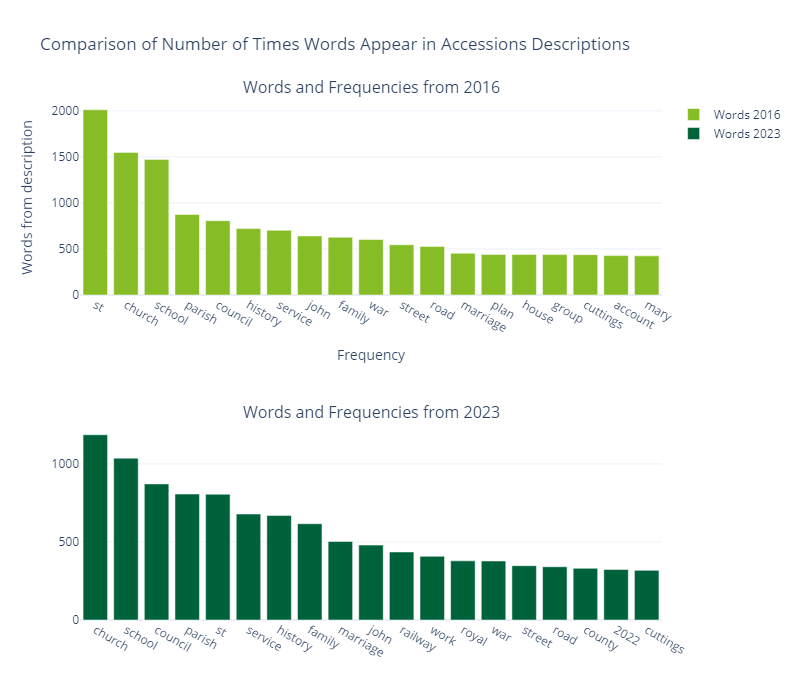
 Accessions data is messy, semi-structured and challenging to work with. The type of descriptive language used can make it difficult to surface themes and topics. However, an analysis of keywords can provide an estimate of the most frequent types of records appearing in the data. Comparing the data from 2016 and that of 2023 suggests there is remarkable stability in collecting patterns. Church, school parish and council records have remained the most prominent type of material collected.
War has remained a popular theme, though has seen a slight decline with the end of the centenary of the First World War. Some of this stability could be linked to the large proportion of local authority archives, which make up nearly 40% of those participating in the survey and are more likely to collect material representing local government and celebrating local communities than specialist archives.
Record creators
Accessions data can help provide an estimate of how representative collections are, whether this might be changing, and it allows us to consider regional variations. The structure and syntax used in the dataset mean it’s challenging to get an accurate picture when trying to measure diversity.
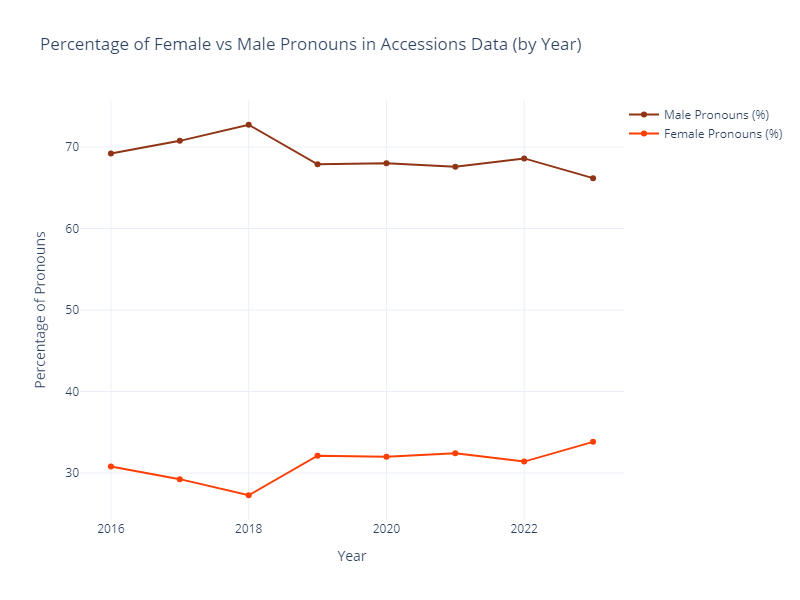
The use of a term does not mean it represents the context of a record, and people are not always described in terms of gender, race or ethnicity. But we can start to see overall trends. Counting the male and female pronouns in the dataset, for example, allows us to estimate the gender divide in collections. And we can see that, overall, collections remain very male dominated.
 But if we look at the regional picture, it’s more nuanced, and we can see that the North East, East of England and Scotland tend to be more equitable in their collections. The South West has shown greater gender balance in collections in previous years. This also varies by type of archive, with specialist repositories tending to have a narrower gender gap while local and national ones have a particularly wide gap in their accessions.
A look at the most frequent terms related to record creators in the data shows similar repetitiveness to the main keywords in descriptions. This suggests that the stability in collecting may be coming at to the expense of reflecting more diverse communities.
Public records and New Burdens funding
Since 2015, certain organisations (mainly magistrates’ courts, prisons, coroners’ courts and NHS bodies) must now transfer their public records selected for permanent preservation to a Place of Deposit 20 years after their creation, rather than the previous 30 years. During the transition period of this change in legislation (2015 – 2024), we have been distributing £660,000 of New Burdens funding from central government to Places of Deposit to help with this increased rate of record intake.
Places of Deposit must notify us of their public record accessions through their Accessions Survey return and we then allocate payments in proportion to a Place of Deposit’s share of the total volume of eligible public records accessioned. 97 Places of Deposit have benefited from New Burdens funding since the programme opened in 2015, with 21 not reporting eligible public records or engaging with the scheme. The 2024 Accessions Survey is the final year that archives can acquire New Burdens funding for their eligible public record accessions.
Following a peak in 2016, there has been a general decline in the number of places of deposit collecting eligible public records. Last year, however, saw nearly a 10% increase with 46 archive services accessioning records eligible for the funding, receiving £633.36 per linear metre:
- Gwent Archives acquired the highest volume of public records in 2023, 119.93 linear metres, mostly of magistrate court records.
- The London Archives has so far accessioned the largest amount of eligible public records across the life of the scheme and has received the most funding. The records accessioned were nearly 900 linear metres in total and were again mostly records from magistrate courts.
- This is followed closely by Birmingham Archive, Heritage and Photography Service with just over 750 linear metres of public records, more than half of which were magistrate court records.
Magistrate court records have consistently made up the largest volume of public records collected, accounting for nearly 70% of all public records accessioned since 2015. NHS records and coroner court records account for 15% and 14% respectively. Other public records reflect only a tiny proportion of records collected.
![Line graph titled 'Total linear meter accessioned per type [of] public record over time'. The vertical axis is named 'total linear meter accessioned', and the horizontal axis is named 'year'. There are 11 lines on the graph, named 'Magistrates Court', 'NHS', 'Coroner Court', 'Prisons', 'Department for Levelling Up, Housing and Communities', 'Maritime and Coastguard Agency', 'Environment Agency', 'Inland Revenue', 'Forestry Commission', 'Department of Environment', and 'Highways England.](https://www.nationalarchives.gov.uk/wp-content/uploads/sites/23/2024/11/lm_type_pr_year.png)
There are also regional variations in the types of public records accessioned, with places of deposit in the North West collecting the largest volume of magistrate court records and those in Yorkshire the least. However, Yorkshire services acquired the most coroner court records while those in the South East accessioned the most NHS records by linear metre. North West repositories took in the lowest volume of hospital records.
The rate of collecting public records, other than magistrate court material, remains quite low but the biggest gap is in digital public records. No significant collections of digital public records of any kind have been acquired by places of deposit across the UK over the past nine years.
Digital records
The volume of digital material accessioned has shown a general upward trend over the past eight years. 15.9 terabytes (TB) of digital records were collected in 2023, which represents about 4% of collections reported. This is a similar proportion to 2022, but the median size of a digital accession has increased from 0.07GB to 0.1GB. These are still very small figures suggesting digital records are not being collected at the same rate as physical material.
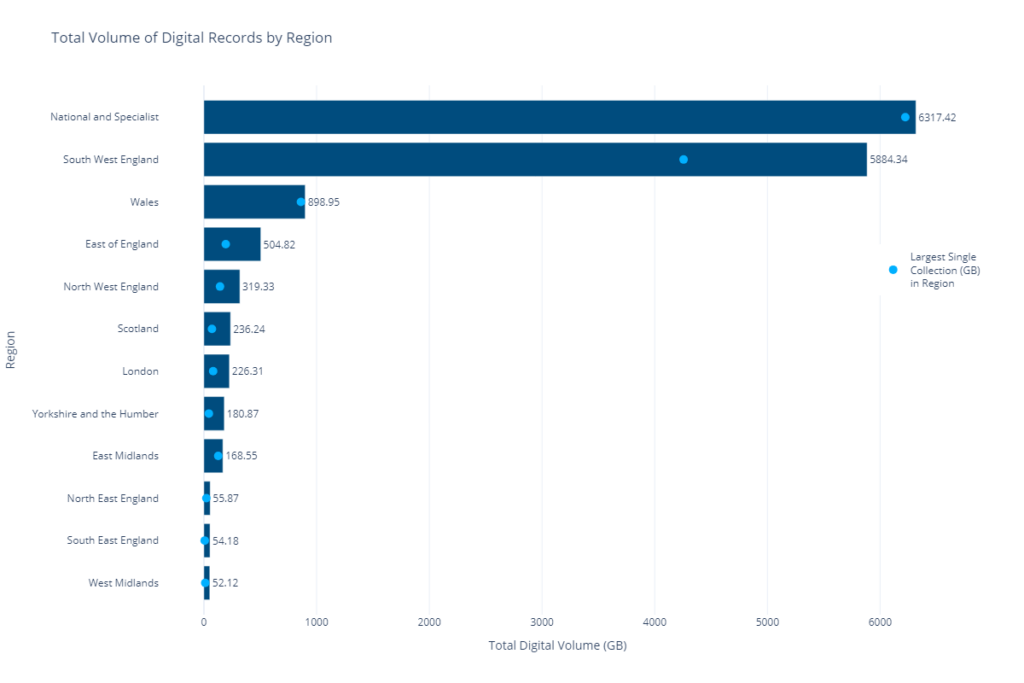
The picture is also uneven across regions and type of archive. Local authority archives, for example, collectively accessioned only 2617GB despite being the largest type in the dataset. Repositories in the Southwest accessioned nearly a third of digital collections, with those in the Southeast and West Midlands accessioning only a very small proportion.
 However, in most cases, a single digital collection represents the majority of GB accessioned. The Public Record Office of Northern Ireland (PRONI), a national and specialist repository, accessioned the largest collection of 6223GB, followed by 4256GB accessioned by Historic England Archive in the Southwest. A small number of repositories are accessioning significant quantities of digital records while the majority are collecting very little or no digital material at all.
Analysing accessions data in this way can help to build an outline of the state of collections across the UK, the type of material being accessioned and where there are gaps and opportunities for improving and creating more inclusive collections.