Participation
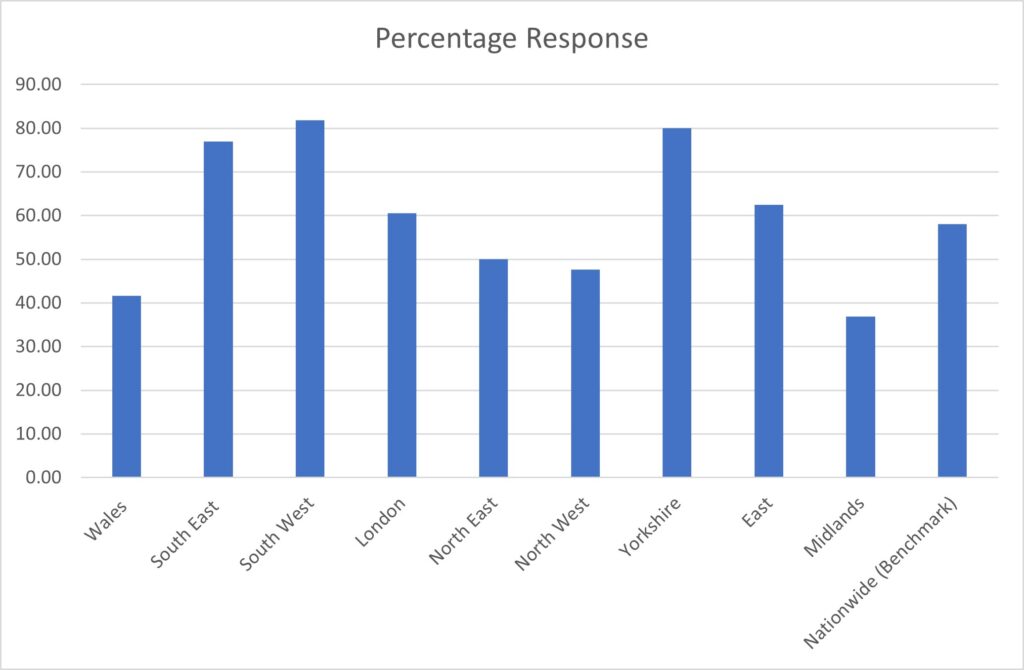
Figure 1
Staffing and Human Resources
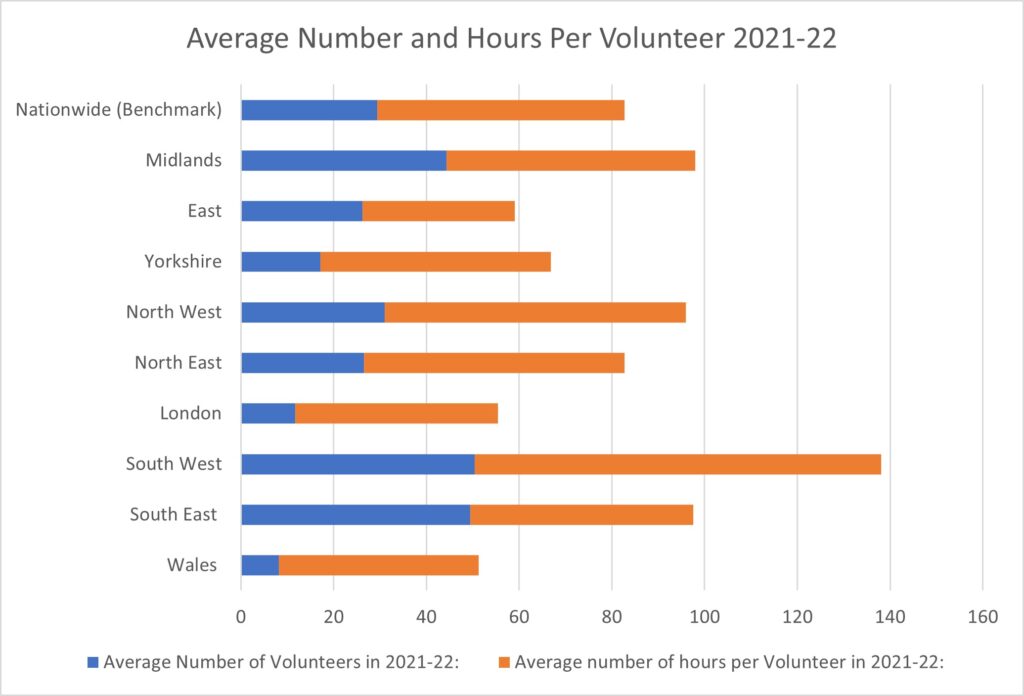
Figure 2
Holdings
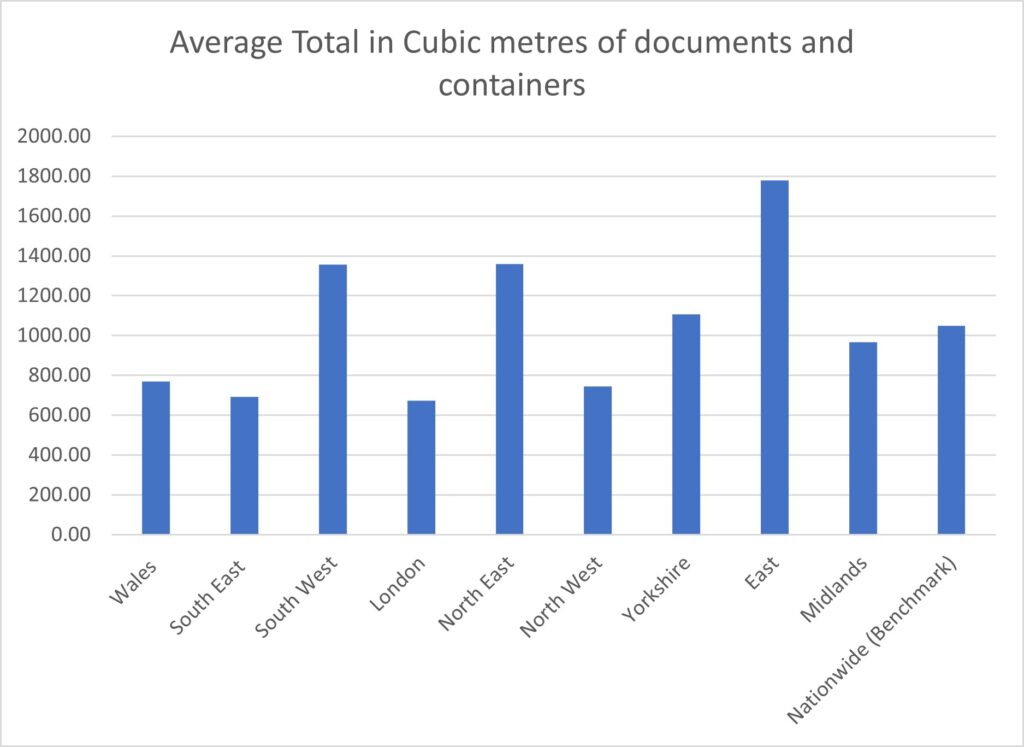
Figure 3
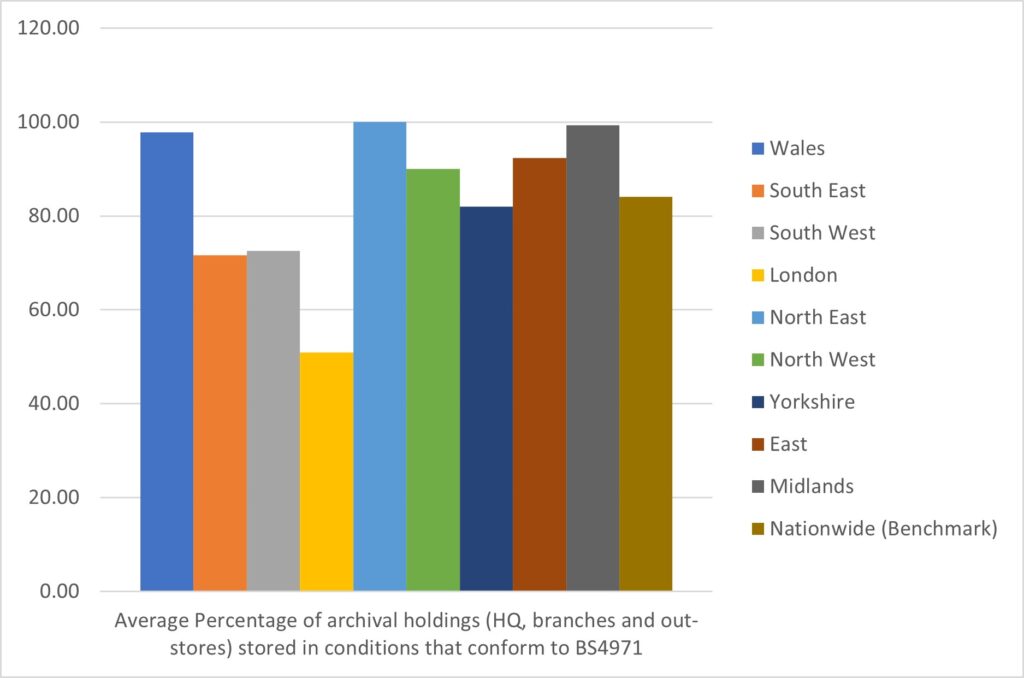
Figure 4
Access and accessibility
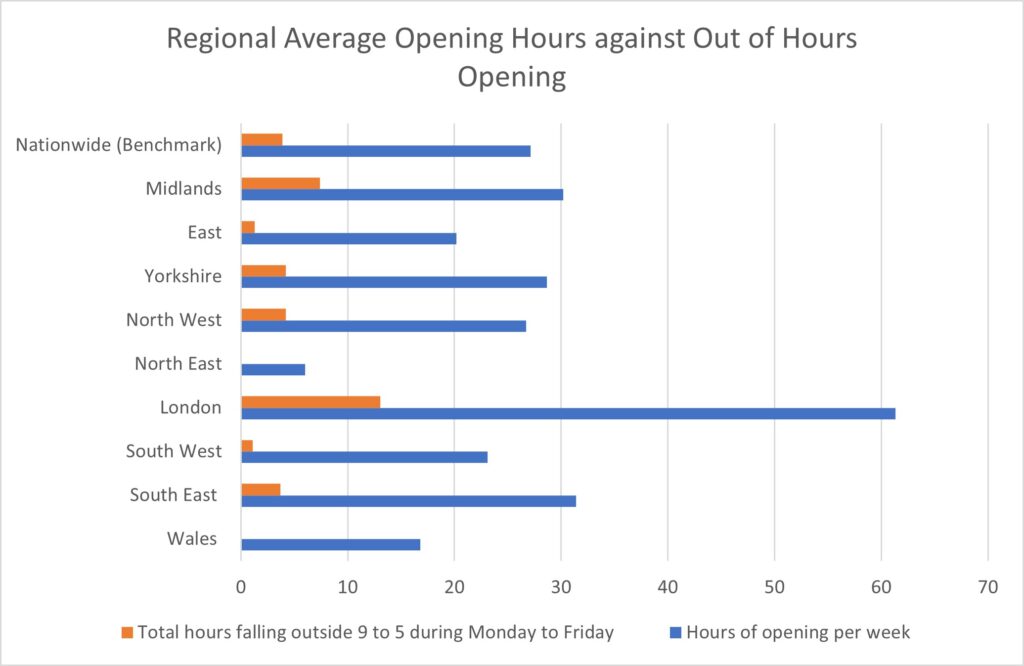
Figure 5
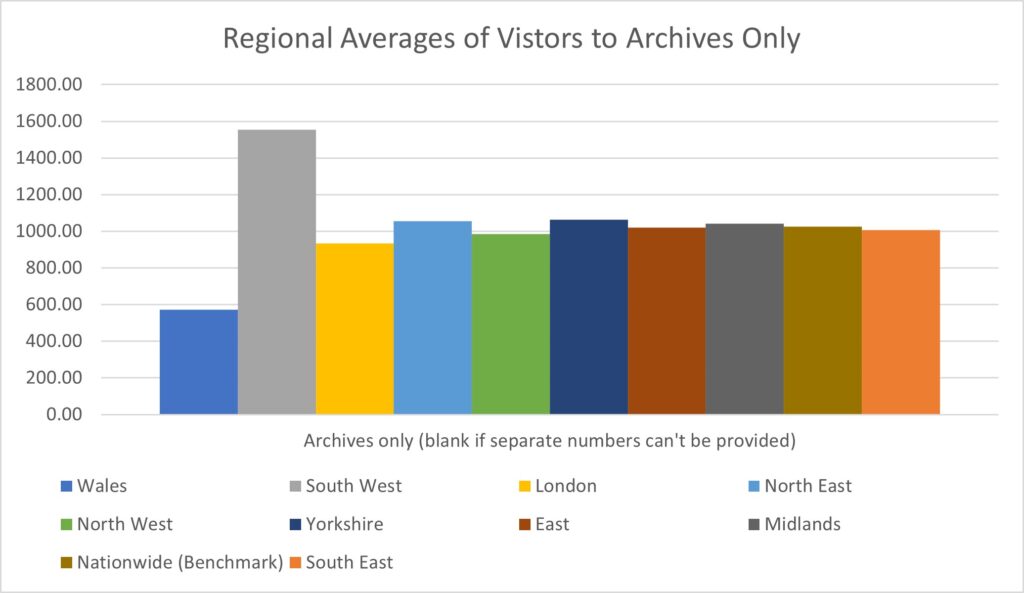
Figure 6
Finding aids
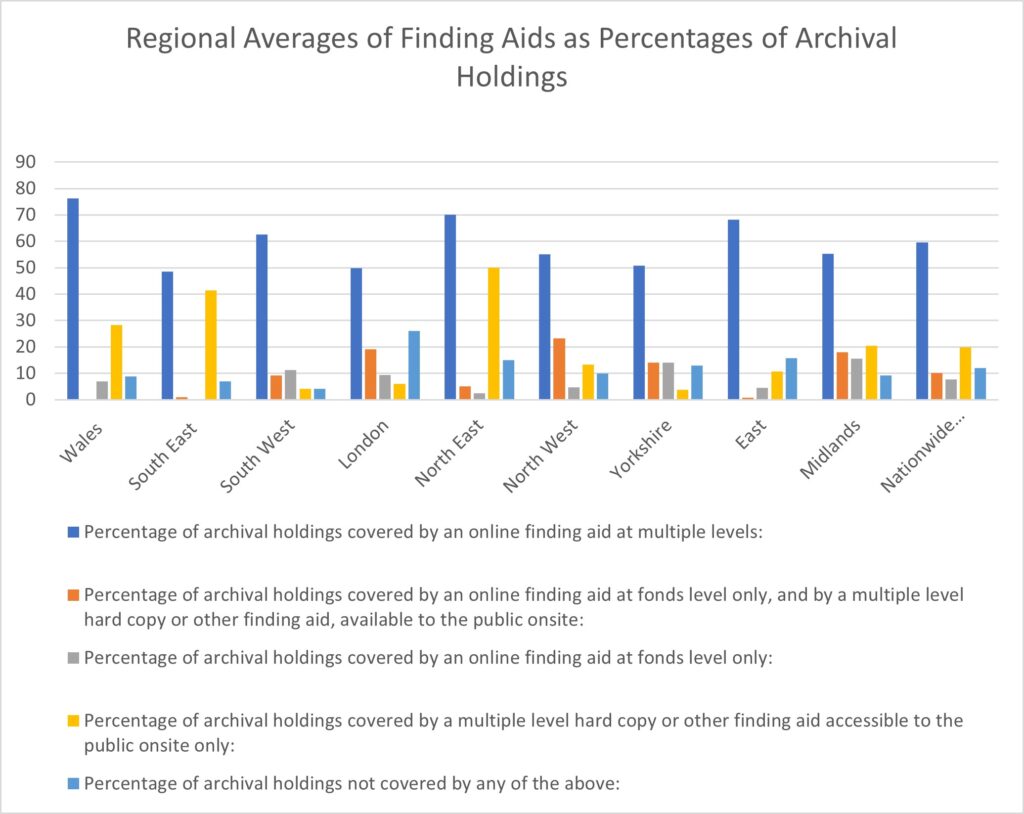
Figure 7
Digital holdings
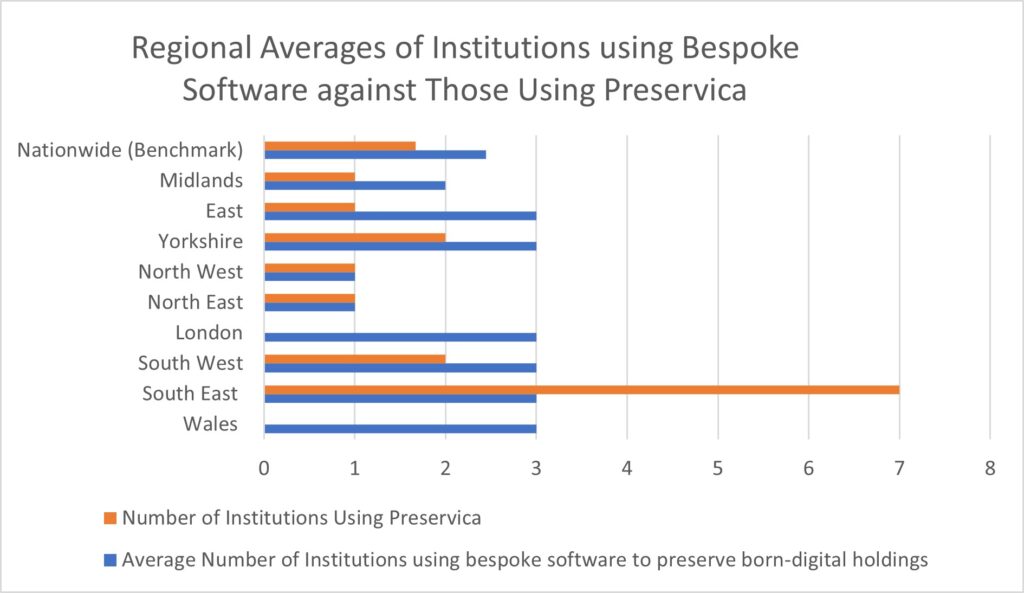
Figure 8
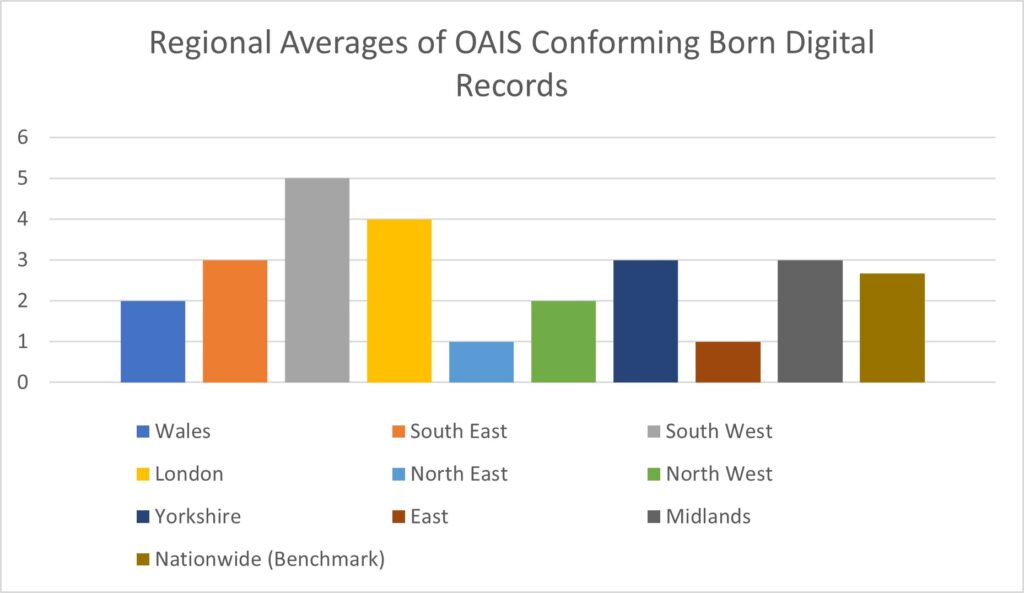
Figure 9
Events and exhibitions
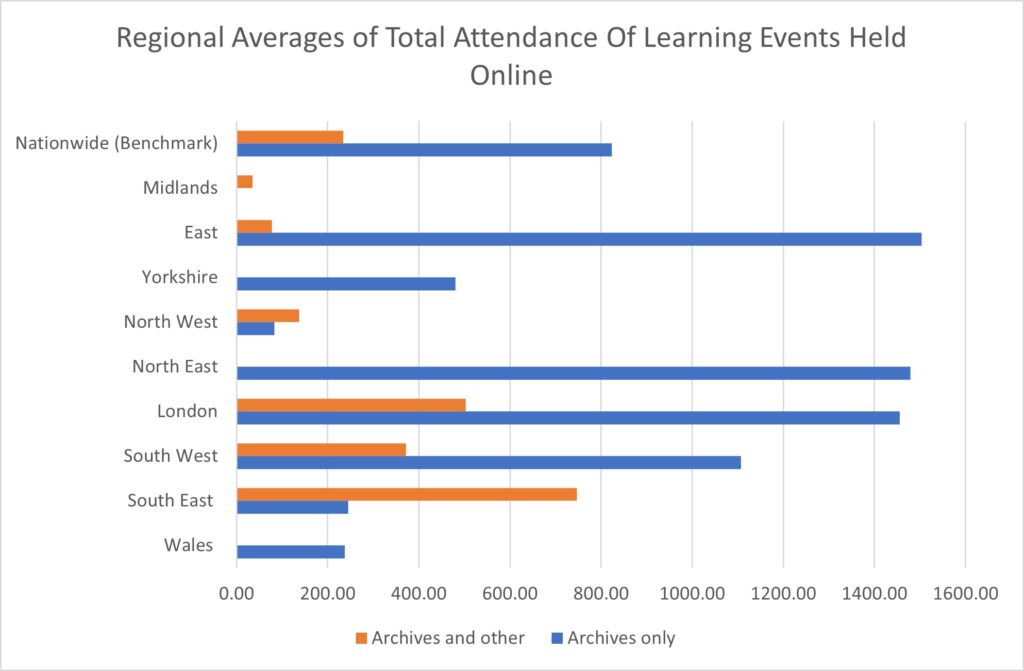
Figure 10
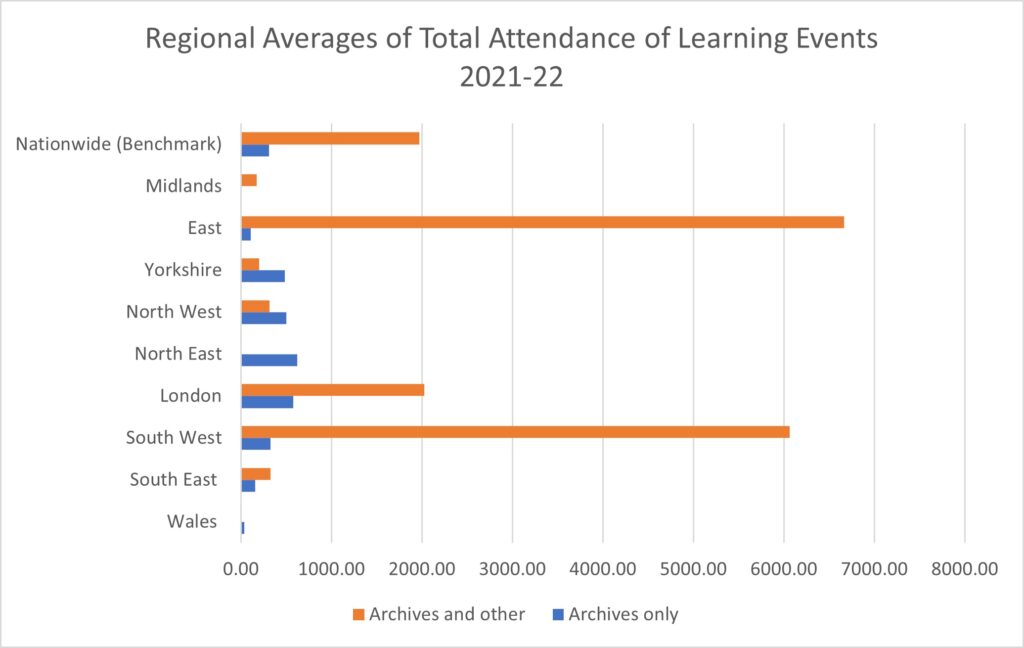
Figure 11
Outreach and social media
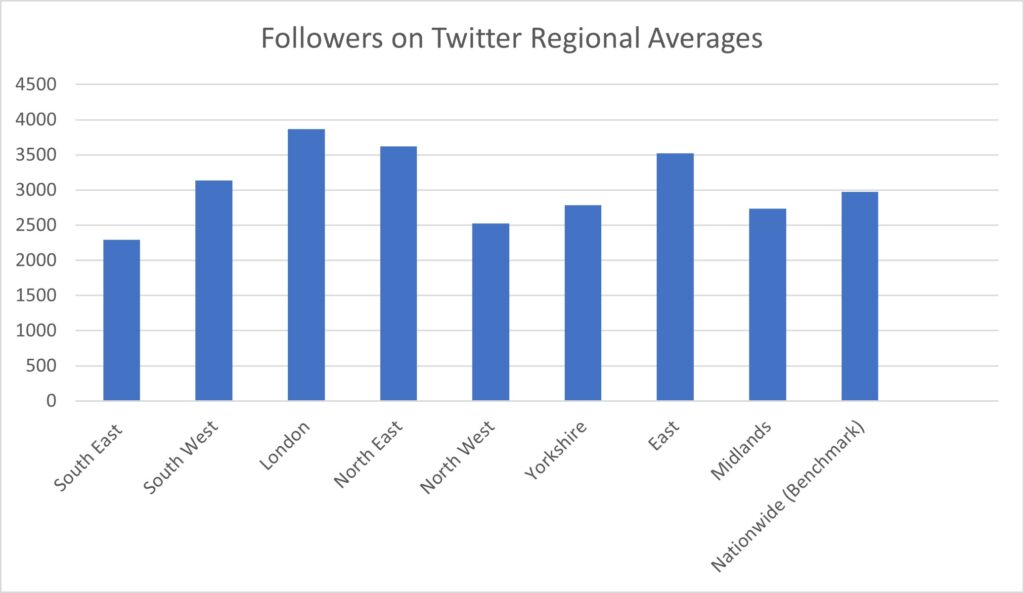
Figure 12
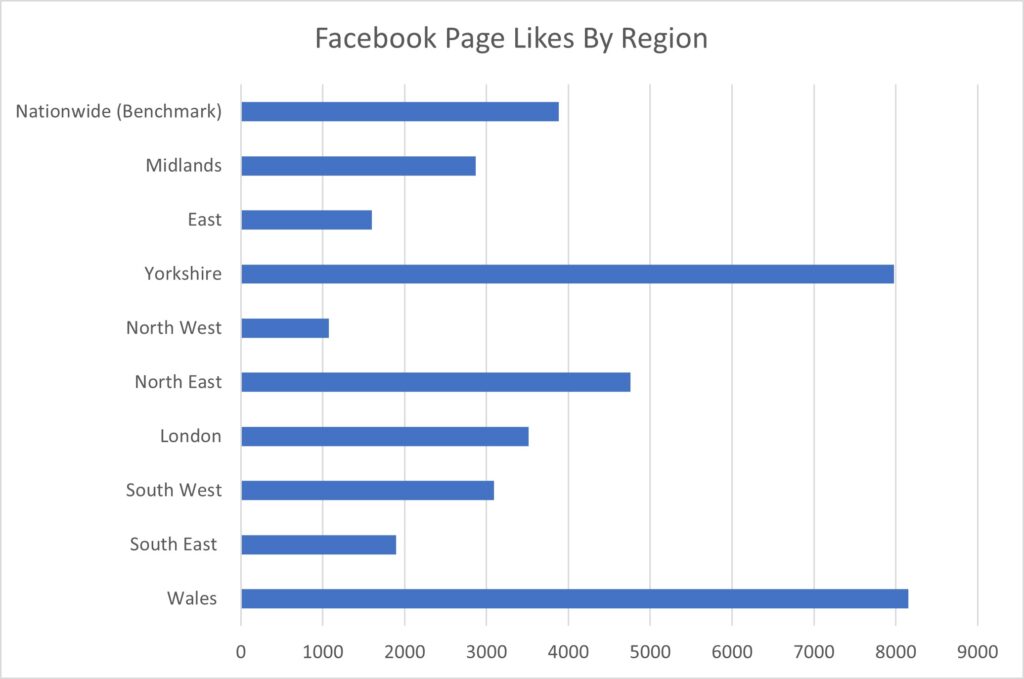
Figure 13
Finance
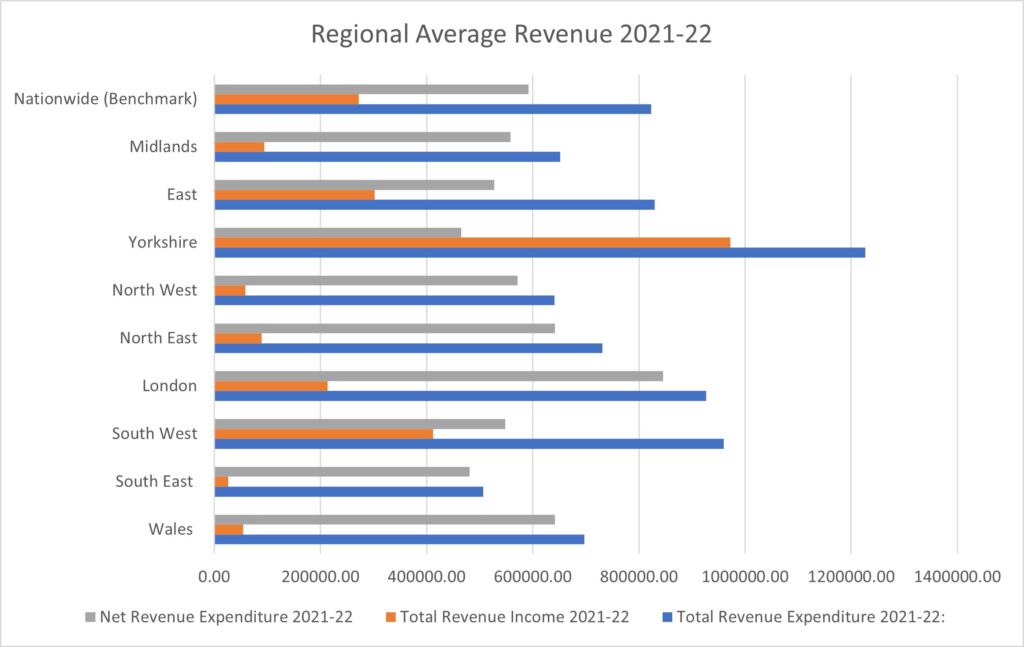
Figure 14